Industrial real estate was already in a transitional state at the end of last year, being placed at the end of a boom cycle of record-breaking construction. Accordingly, the sector is still absorbing deliveries while new construction is the lowest it’s been in years, but geopolitical shifts promise to further complicate the transitional period. In particular, trade war concerns could bring more manufacturing activity back to U.S. shores, but the materials required in the manufacturing process — and those required to build the plants themselves — will be more expensive. At the same time, e-commerce demand is still on the rise, with Amazon planning a new wave of logistics centers totaling $15 billion — even as imports from China are complicated by the rapidly developing tariff situation.
Phoenix was the best-scoring industrial market in Q1 2025, still being boosted by its solid ongoing construction compared to other markets. More precisely, Phoenix delivered 8.6 million square feet of space in Q1, almost double the amount delivered in second-place Dallas-Fort Worth. These deliveries brought along a 2.2% expansion of industrial inventory in Phoenix. For comparison, all other markets recorded expansions of less than 1%. Even so, the construction boom may be petering out in the Valley of the Sun, as the remaining pipeline totals 15.7 million square feet, which is down from 22.3 million in Q4 2024 — indicating there were almost no new construction starts market-wide in Q1. This also means that Phoenix no longer houses the largest industrial pipeline in the U.S., losing that title to Dallas-Fort Worth for the first time in several years.
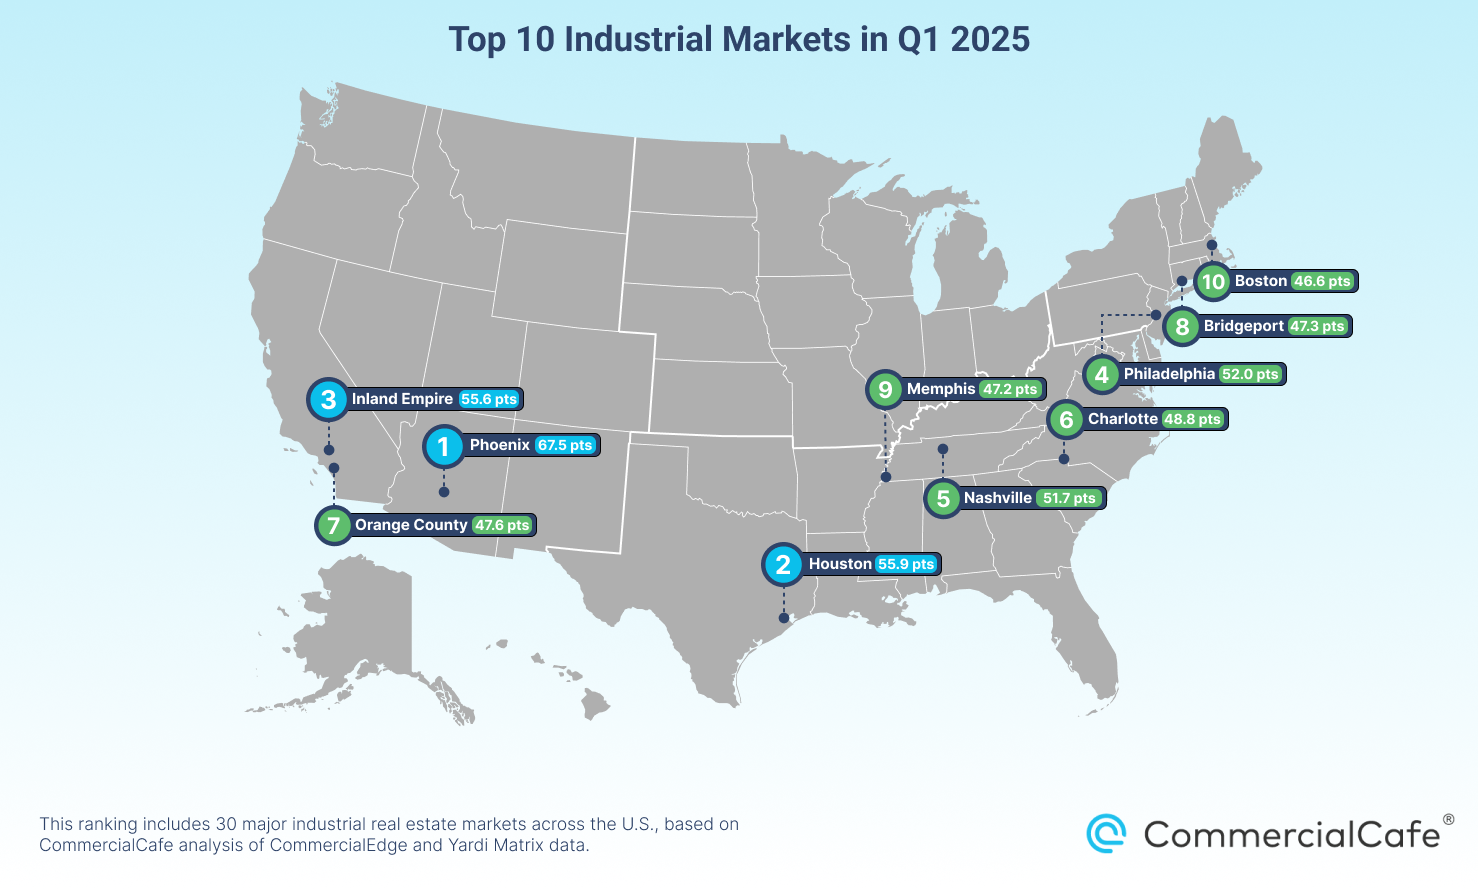
In second place, Houston experienced a sharp climb in the standings to 55.9 points thanks to strong fundamentals, including a yearly increase in average sale price per square foot of almost 10% and a vacancy rate of 6.7%, down 0.5% since Q4. Moreover, Houston’s pipeline now stands at 14.8 million square feet, up 14% from Q4’s 12.9 million. Additionally, the metro stands out as one of the Southern markets with the most robust demand for logistics and distribution space. This is reflected in the fact that search interest for industrial real estate keywords here is stronger than in any other metro area in the country, with the exception of Miami and Los Angeles.
The Inland Empire scored as the third-best industrial market in Q1 2025, retaining its place in the standings from Q4 2024. Notably, the market remains one of the tightest nationwide, with in-place rents reaching $11.10 per square foot after a yearly growth of 12.1% — the fastest growth nationwide. Moreover, after a period of loosening vacancies, the rate dropped by 0.5% between Q4 2024 and Q1 2025 to reach 7.3%, indicating that deliveries slowing to a crawl are beginning to make their effects felt here. The Inland Empire saw only 710,000 square feet of industrial space go online in Q1, which is less than the amount delivered in markets like California’s Central Valley or neighboring Los Angeles.
On the opposite coast, Philadelphia stands as the fourth-strongest industrial market nationwide with a total score of 52 points. The market experienced the fifth-highest increase in average sale prices per square foot of industrial space at 11.2%, while also scoring above average in vacancy rate (7.9% at the end of March), and in-place rent growth (up 8.3% year-over-year). The Philly market now has the 11th-lowest vacancy rate in the study and the lowest on the East Coast (besides Bridgeport, Conn.).
In fifth place, Nashville, Tenn., also climbed sharply in the standings with strong indicators in rent growth, vacancy and more. At $6.60 per square foot, the average asking rent here is up 11.5% between March 2024 and March 2025, representing the third-fastest growth in the entire study. Vacancies also sit at a measured 7.9% (below the midpoint of the ranking) after rising by 0.3% since last quarter. In addition, an above-average pipeline and last-quarter deliveries also helped Music City earn a high place in the standings.